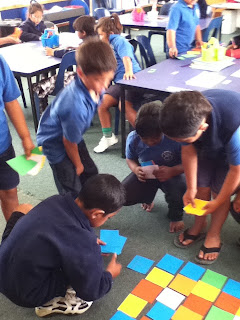
Room 22 were studying Statistics for math. We had been drawing bar graphs, so we decided to make a bar graph of all the names in the class.
As you can see from the photos first we got different coloured paper and put one letter of our name on each piece. Then starting with the smallest number of letters, we began to make our bar graph. You can see some of us looking at the graph and talking about what we could tell by our graph. There were 7 people who had a 6 letter name, the shortest name was only 4 letters and the longest name was 10 letters long! We discussed our graph and decided that we could also make a graph of the most popular letters, and the most popular coloured paper.


No comments:
Post a Comment
Feel free to post a positive comment